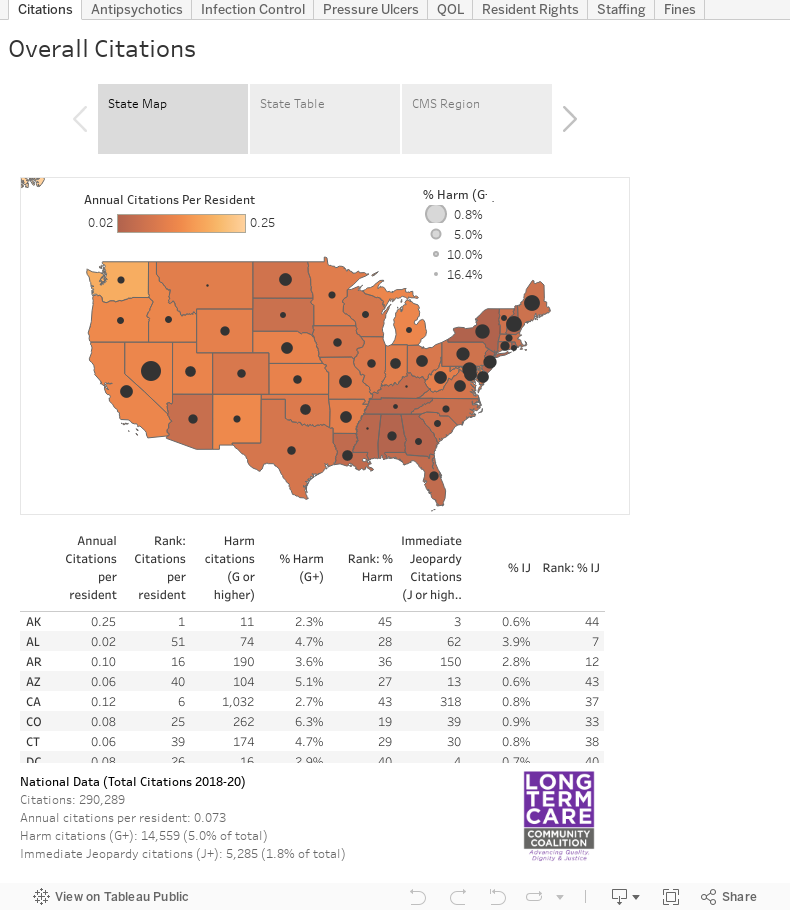
LTCCC’s report on nursing home oversight features interactive maps and tables illustrating enforcement performance at the state, regional, and federal levels. Each section includes a state map (darker colors mean lower enforcement rates), and sortable state and regional tables with data and rankings. To change categories, select the tabs on the top. To sort the information in a table, click on any column heading. This will open a box that will enable sorting from low to high, high to low, or download of the data to a PDF or Excel file. For the most user-friendly experience, click here to access the charts directly on Tableau.